A Four-Site Plantar-Pressure Insole: Transducer Error Budget, Feature Equivariance, and Sparse-Versus-Dense Agreement in Overground Walking
Accepted for Presentation — IEEE-EMBS IECBES 20262026 IEEE-EMBS Conference on Biomedical Engineering and Sciences · Kuala Lumpur, Malaysia · December 9–11, 2026. Accepted September 30, 2026. Revisions and the final manuscript are due October 15, 2026; the final paper has not been submitted or published yet.The question
The interesting problem was never "can a shoe sense pressure?" Cheap force sensors have done that for years. The interesting problem is what a very sparse sample of the foot can honestly say. A dense in-shoe array records the whole plantar surface, but it is expensive and mostly stays in gait laboratories. A four-sensor insole could be worn every day, but four points are not a pressure map. Before anyone trains a model to flag risk, three prior questions have to be answered in measurement terms:
- How accurately do the sensors recover force, and where in their range are they least trustworthy?
- What does a four-point sample of a continuous pressure field keep, and what does it structurally destroy?
- Which downstream features survive the systematic errors the device makes on its own?
None of these needs a diagnosis label, and all of them limit what any label-based result could later mean. That is why the paper treats X-Step as a measurement instrument and not a classifier.
Where my work starts
I did not design the sensing hardware. The X-Step team had already built the insole, chosen its four sensing sites, and written the firmware before the questions in this paper existed. My research begins downstream of those decisions, with the pressure readings the system produces. The question I was working on was: given these readings, what do they actually preserve?
firmware · BLE framesnot my work
grouped vs ungrouped evaluation
sparse-vs-dense correlation study
The team's work
- The insole and its four sensing sites (MET1, MET2, MET5, heel)
- Electronics, ESP32 firmware, 25 Hz sampling, the BLE frame
- The sensor-site rationale, and the other authors' parts of the paper
My part
- Processing the pressure data into rolling 4-second windows
- The 59-feature map and the 540-parameter logistic-regression head
- Grouped versus ungrouped evaluation of that pipeline
- The sparse-versus-dense correlation study
The paper also contains work I did not do and do not claim: the bench calibration of the transducers, the error budget built from it, and the synthetic cohort generator and its fault experiments. I describe them below where the story needs them, as the team's.
Chronicle
This chronology is reconstructed from dated files: manuscript PDFs and their metadata, the team's repository history, my own model repository, and the conference system's records. It places milestones, not thoughts. Where the files don't date an individual analysis, I give the month the manuscript reached that form, and I say so.
-
August 2025 – February 2026
Before the paper: a product, not a research question
X-Step began as a student startup (August 2025). Its first software was an app, submitted to the Congressional App Challenge in October 2025. On February 15, 2026 I started a repository for two image-classification prototypes (foot-pressure heatmaps and wound photographs) and saved published smart-insole papers to read alongside them. All of this belongs to the product. None of it was yet a paper about what four sensors can measure.
Dated from: first app commits (Oct. 30, 2025); repository creation and file timestamps (Feb. 15, 2026). The product is described on the X-Step page.
-
July 2026
First manuscript: "does the whole system work?"
Question at this stageCan an insole, an app, and two image classifiers be written up as one framework, and how well does each part perform?The first full draft in this lineage, compiled July 6, was a systems paper. It presented a multimodal framework with two machine-learning components and reported headline accuracies of 99.45% and 87.66%. It framed the work as establishing feasibility for pre-ulcer surveillance. The team's repository also began its shared machine-learning package that day.
Dated from: manuscript PDF metadata (July 6, 2026); first commit of the shared ML package (July 6, 2026).
-
August 2026
The numbers looked too good, so the evaluation became the subject
New questionWould these results survive a stricter split, and which of them were measuring the wearer instead of the physics?In mid-August, the team's repository gained grouped evaluation splits, sensor-ablation and perturbation experiments, calibration analysis, and written audits, including one on subject leakage and one on any metric that looked suspiciously high. The audit rule was blunt: a score near 0.98 on a wearable task is treated as suspect until explained. Its entries record that a 0.931 macro-F1 came from a protocol that let windows from the same subject land on both sides of the split, and that the honest figure was the grouped 0.885.
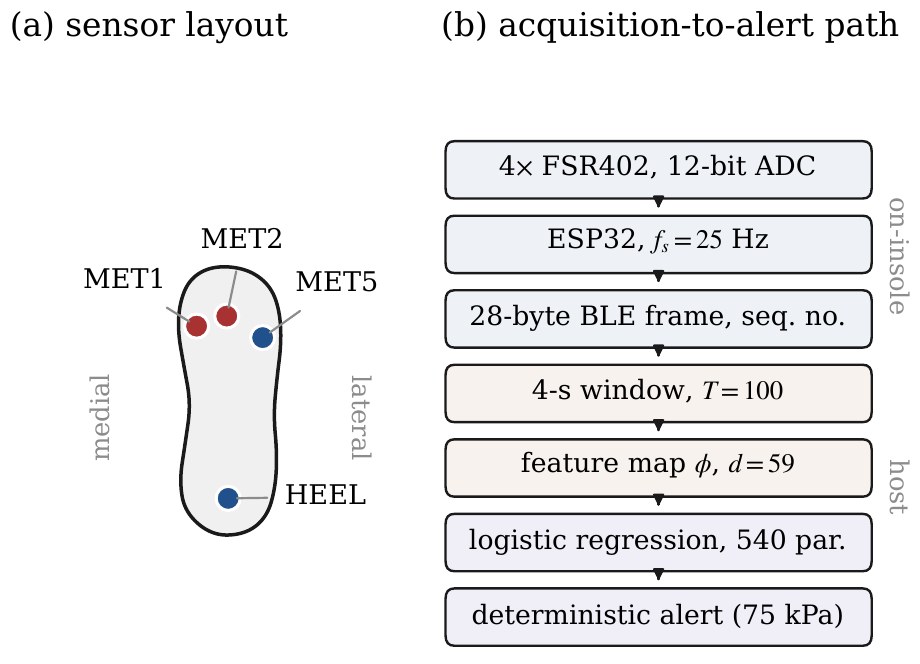
Figure 1 of the paper. The boxes marked "on-insole" are the team's hardware. From the 4-second window down (windowing, the 59-feature map, the 540-parameter model) is the pipeline I built and evaluated. Dated from: repository history, August 18–19, 2026, and the audit documents committed with it.
-
September 1, 2026
A claim-by-claim check against the code, and a smaller paper
Methodological problemWhich sentences in the July draft could actually be traced to code and data?On September 1 the team checked the July manuscript against the repository line by line. Several details did not hold: some hardware specifics did not match the firmware, a claimed calibration improvement could not be reproduced, sample sizes were wrong, and the two image classifiers had been described as something they were not. The long draft was corrected: the classifiers were renamed for what they actually were, their headline accuracies were re-verified from the trained models, and the clinical-feasibility language came out. The check also surfaced the observation that mattered most for this paper: neither classifier reads the insole's own pressure signal, so neither could be evidence about what the insole measures. The paper that was eventually submitted contains neither of them; they belong to the product.
The same day also produced a shorter, blind-review version of the paper with a new framing: not "does the system work?" but "how much information do four sites retain, and do the models survive subject-independent evaluation and sensor faults?"
Dated from: the correction map and revision report committed Sept. 1, 2026; the blind-review PDF (Sept. 1, 2026).
-
September 2–14, 2026
The paper's questions take their final form
The dated files show the manuscript reaching its final shape between September 1 and 14: the title became the one above, and the argument settled into four questions. They don't date the individual analyses, so each is described by what it asked.
Sparse versus dense: what does "reproduce" mean?Can one sensor stand in for a whole region? That depends on what you ask the sensor to reproduce.The study compared the cell of a dense 32-cell insole nearest each of the four sites with the dense cluster around it, across 149 recordings from 15 healthy adults in an independent public archive. These are not X-Step recordings: no human walking data from X-Step exist yet, and the paper says so. Median correlation of the waveforms was high: 0.986 at MET2, 0.885 at the heel, 0.879 at MET1, and 0.717 at MET5. Read naively, that looks like near-perfect recovery.
It isn't, and the distinction is the point. Pearson correlation ignores scale: a sensor reading half the pressure still correlates perfectly. These numbers certify shape, meaning that the sparse site rises and falls when the region does. They say nothing about magnitude. The device's alert, however, is a threshold in kilopascals, so the number that matters is how well peak-to-peak amplitude agrees, and it falls to 0.43–0.74. A sparse site tells you reliably when a region loads and unreliably how hard. (The archive reports raw ADC counts, not calibrated pressure, so the paper declines to convert either figure into a limits-of-agreement interval.)
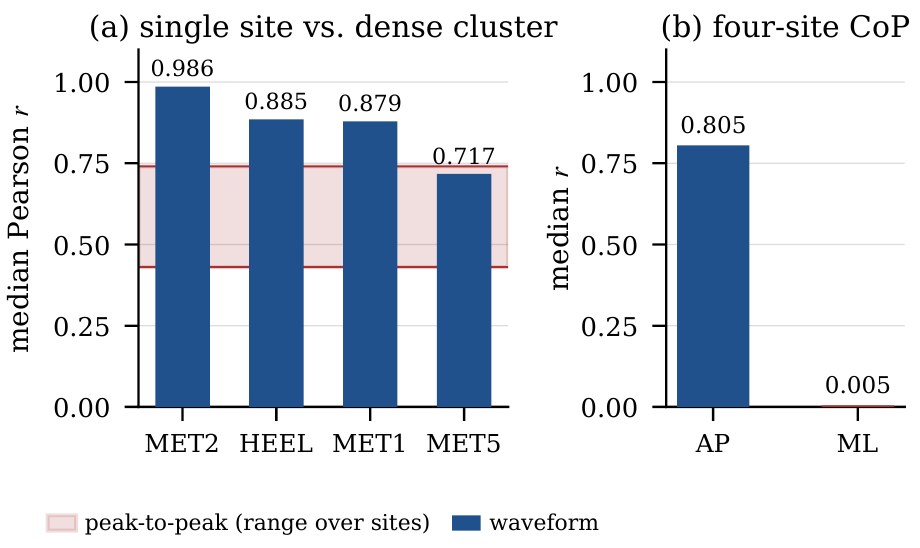
Figure 3 of the paper. Left: the bars show waveform shape, which survives; the shaded band shows peak-to-peak amplitude, which does not. Right: the four-site center of pressure tracks heel-to-toe motion (0.805) and loses side-to-side motion (0.005). The correlations come from one study I designed. New question: what is impossible to recover?Is there something four sites can never reproduce, however accurate they are?The center of pressure is a pressure-weighted average of the sensor positions. A weighted average can never leave the region spanned by the points being averaged. With three sites clustered across the forefoot, one at the heel, and none across the midfoot, there is almost no width to average over. The reconstruction tracked heel-to-toe motion (r = 0.805) and lost side-to-side motion (r = 0.005). This is a finding about the existing layout's geometry, not about sensor accuracy: no calibration improvement could repair it. It is also not an impossibility theorem. A learned model with priors could extrapolate; what the geometry rules out is direct reconstruction.
Which features break when the sensor is wrong?The team's bench calibration showed errors on the same scale as the 30 kPa contact threshold. Would every feature suffer equally?Not equally, and this can be shown without data. Adding a constant offset to every reading, as a drifting sensor would, shifts peaks and means by that offset, which a downstream linear model can partly absorb. But features that count the fraction of time above a threshold are different: a lightly loaded site spends its time close to the threshold, which is also where the transducer is least trustworthy, so a small offset flips many samples. Zero-mean noise of the same size does not shift that count to first order. Subtracting a low quantile of each window removes any constant offset before features are computed. A synthetic test agreed with the prediction: 12 kPa of noise cost 0.206 in macro-F1, while a constant +15 kPa offset cost 0.666, three times as much for a comparable disturbance. I describe this as the paper's finding; the analysis of the error budget and the synthetic generator were not my work.
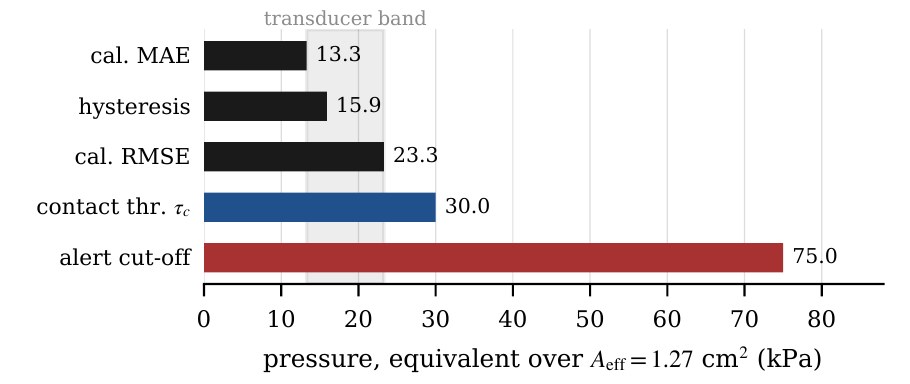
Figure 2 of the paper (the team's bench analysis). The 30 kPa contact threshold sits barely above the calibration error, which is why threshold-counting features are the fragile ones. Does the evaluation let the model recognize people?If a random split puts windows from the same person in both training and test, what is the model actually learning?In the synthetic cohort, each of the 24 virtual subjects contributes 108 windows. Split at random, a model sees some of each subject during training and is then tested on more of the same subject, so it can score by recognizing the individual's signature instead of learning anything general. Split by subject, so that test subjects are entirely unseen, the same pipeline reaches macro-F1 0.885 (against 0.040 for always guessing the majority class); with the leaky random split it reaches 0.931. The 0.046 gap is the price of meeting a new wearer, and it is larger than the whole spread between the best and worst classifiers tried. In other words, how the data were split mattered more than which model was used.
One result I do not want read as more than it is: peak-only features scored 0.886 against 0.885 for all 59. That does not show the full feature map is unnecessary. It shows that the synthetic generator's labels are close to separable by peak pressure alone, which is why the paper confines all synthetic results to one section and states that no claim elsewhere depends on them.
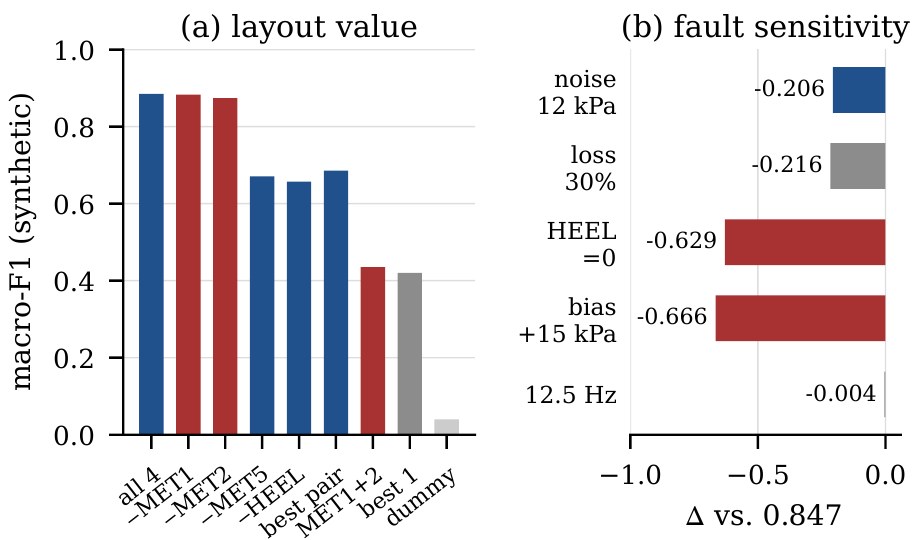
Figure 4 of the paper, from the synthetic cohort only. Left: removing MET1 or MET2 alone costs little, but the two substitute for each other, and the forefoot-only pair does worse than any pair with a rear or lateral site. Right: a constant bias hurts about three times as much as noise of similar size. Dated from: the manuscript PDF versions of Sept. 1, Sept. 8 and Sept. 14, 2026. Between the last two, only small changes appear: a section was renamed from "threats to validity" to "limitations", and the data-availability statement now points to a public repository of the calibration table and analysis code.
-
Mid-September 2026
Submission
The version held in the conference system, as paper #132, is the September 14 manuscript. The system ran its similarity check on September 16. The submitted paper says what it is: engineering-level evidence, no X-Step walking data, no ulcer-prediction or clinical-benefit claim.
Dated from: manuscript file (Sept. 14) and the conference system's similarity record (Sept. 16). The exact submission day is not recorded in the files I have, so I give the month.
-
Peer review · between submission and September 30, 2026
What the reviewers asked
Two reviewers read the paper; both rated every criterion, from technical contribution to presentation, as agree. They also asked for specific changes. I am summarizing, not quoting.
- The title promised more than the validation. One reviewer pointed out that the title says "overground walking" while the validation rests on an archive of movement recordings and on a synthetic analysis, and asked for the title to say so. That is a fair point: the paper itself states that no X-Step walking data exist, so the title should not suggest otherwise.
- Compare four sites against the full 32 directly. The same reviewer asked for a direct comparison of the four sensor locations against the full 32-sensor data, to show how much pressure information is lost. The paper's own discussion names this as its obvious next analysis: subsample the 32-cell array to the four anatomical sites and ask what is lost in peak pressure, pressure–time integral and center-of-pressure excursion. It would also remove the problem of comparing across two different pieces of hardware, which is why the current study can only speak about four-point sampling in general.
- Clarity. The second reviewer called the study well executed and technically sound, and asked for abbreviations to be defined at first use, citations to match the conference format, an incomplete sentence to be fixed, parameters to be defined where they appear, and a fuller explanation of the sensitivity equation (Equation 2).
-
September 30, 2026
Accepted for presentation
The conference notified the authors on the evening of September 30 that the paper was accepted for presentation at IECBES 2026, with the review comments attached.

The conference system's record for the paper (cropped to the title, conference and status). 
The notification's acceptance sentence. Next: revisions and the final manuscript
The notification asks the authors to revise the paper according to the reviewers' comments, format the final manuscript to the IEEE template, register, and upload it by October 15, 2026, before presenting in Kuala Lumpur on December 9–11. None of that is done yet, and I will add the final-manuscript milestone here only once it is. Acceptance for presentation is not publication: nothing has been published in the proceedings.
What the paper does not show
- It contains no X-Step walking data. The sparse-versus-dense study uses someone else's insole, so it describes four-point sampling in general, not this device.
- The 149 recordings come from 15 people, so they are not independent subjects. The correlations are descriptive, with no p-values.
- The synthetic cohort comes from a generator whose labels are close to separable by peak pressure. Its results say nothing about real wearers.
- The bench calibration errors are in-sample, not held-out. Drift, creep, radio airtime and battery life were not measured.
- Nothing in it establishes ulcer prediction or clinical benefit. The paper separates physical engineering evidence, algorithmic evidence on a stated dataset, and clinical evidence, and contributes only to the first two.
Reflection
Three results changed how I think about sensing and machine learning.
A strong correlation can answer a weaker question than the one you care about. A waveform correlation of 0.986 looks like success until you ask what it is invariant to: it says nothing about how hard a region is loaded, which is exactly what a thresholded alert depends on. The statistic has to match the decision.
Geometry sets limits that modeling cannot remove. Side-to-side center of pressure fails because of where the sensors are, not how well they are read. This reframes sparse sensing: how widely the sites are spread can matter more than how many there are, and a negative result like this says what a redesign would have to add.
The evaluation design can matter more than the model. The gap between a leaky split and a grouped one was larger than the gap between the best and worst classifiers. A high score on samples that are not independent answers a different question from the one a new wearer poses. Underneath all three is an ordering that this project made concrete: validate the measurement before you predict anything clinical.
How this page was dated
Dates come from manuscript PDF metadata and file timestamps, commit dates in the team's repository and in mine, and the conference system's records. They show when documents reached a form, not when an idea occurred, and I have not written diary entries I did not keep. Where a date isn't in the files, I give a month. The start of this research is set at July 2026, when the first manuscript in this lineage was compiled; the product work that preceded it started in August 2025.