Predicting Cognitive Function Using Transformer-Derived Speech Representations and Longitudinal Coherence Features
Under peer review · submitted August 04, 2026
Question
Dementia is usually tracked with short cognitive tests such as the Mini-Mental State Examination (MMSE, scored 0–30), given at clinic visits months apart. The Pitt Corpus visits also include recorded, transcribed speech. The question here is whether that speech, together with the clinical history already on file, can forecast the patient's MMSE score at a later visit.
This is framed as a regression problem: given everything known up to one visit, predict the MMSE at the next one. It is a forecast, not a diagnosis.
Data
Transcripts come from the DementiaBank Pitt Corpus, used under DementiaBank's controlled-access agreement; the repository contains no corpus data. Patients with only one visit, no transcript, or a missing MMSE at the target visit were excluded.
| Patients | 126 | 69 dementia, 57 control |
|---|---|---|
| Visits per patient | 2–5 | most had 2 or 3 |
| Prediction samples | 173 | 1–4 prior visits → MMSE at a later visit |
Representation
Each prediction sample becomes a 53-dimensional vector built from three blocks.
Discourse coherence (Sentence-BERT)
Every sentence is embedded with Sentence-BERT. Adjacent cosine similarity measures local continuity; global coherence compares the first and last sentences; semantic slope fits the trend of each sentence's similarity to the opening sentence (negative means drifting away); topic drift measures distance from the transcript's mean embedding; embedding variance captures erratic jumps.
Lexical and syntactic (spaCy)
Filler rate, 50-token moving-average type-token ratio (MATTR), inter-sentence repetition, mean sentence length, fragment ratio (sentences with no verb, from POS tags), named-entity rate and generic-word rate. Together with the five coherence features, these are the 12 per-visit features.
- 12 linguistic features from the most recent prior visit: the patient's current speech state, not an average over history.
- 8 change features: visit-to-visit differences (Δ) for eight of the twelve.
- 4 temporal features: number of prior visits, gap to the target visit, mean gap, total observation span.
- 20 semantic components: 384-dimensional SBERT transcript embeddings reduced with PCA.
- 9 clinical and demographic features: entry MMSE, Blessed Dementia Rating, CDR, NYU staging, Mattis DRS, baseline diagnosis, age, education, sex.
Model
The model is LightGBM, a gradient-boosted tree ensemble, chosen for a small tabular dataset with mixed feature types. Before training, the pipeline runs these steps:
- RobustScaler normalization, which limits the influence of outliers.
- Correlation pruning: one of any pair with |r| > 0.8 is dropped; clinical variables are kept.
- Permutation-importance selection with a preliminary LightGBM keeps the 15 most useful features, and the clinical variables are added back.
- Quantile binning (KBinsDiscretizer) appends a discretized copy of each feature.
- Gaussian augmentation: three noisy copies per sample (noise at 2% of each feature's SD), each tagged with its parent patient.
- Optuna (Tree-structured Parzen Estimator, 200 trials, 10 hyperparameters), scored by mean validation R² across the patient-grouped folds.
Evaluation and the leakage problem
In October 2025, while checking the cross-validation code, I found that it split the data by visit rather than by patient. With several visits per person, one visit could land in training and another in validation. The model could then score well partly by recognizing a person, not by learning anything general about speech and cognition.
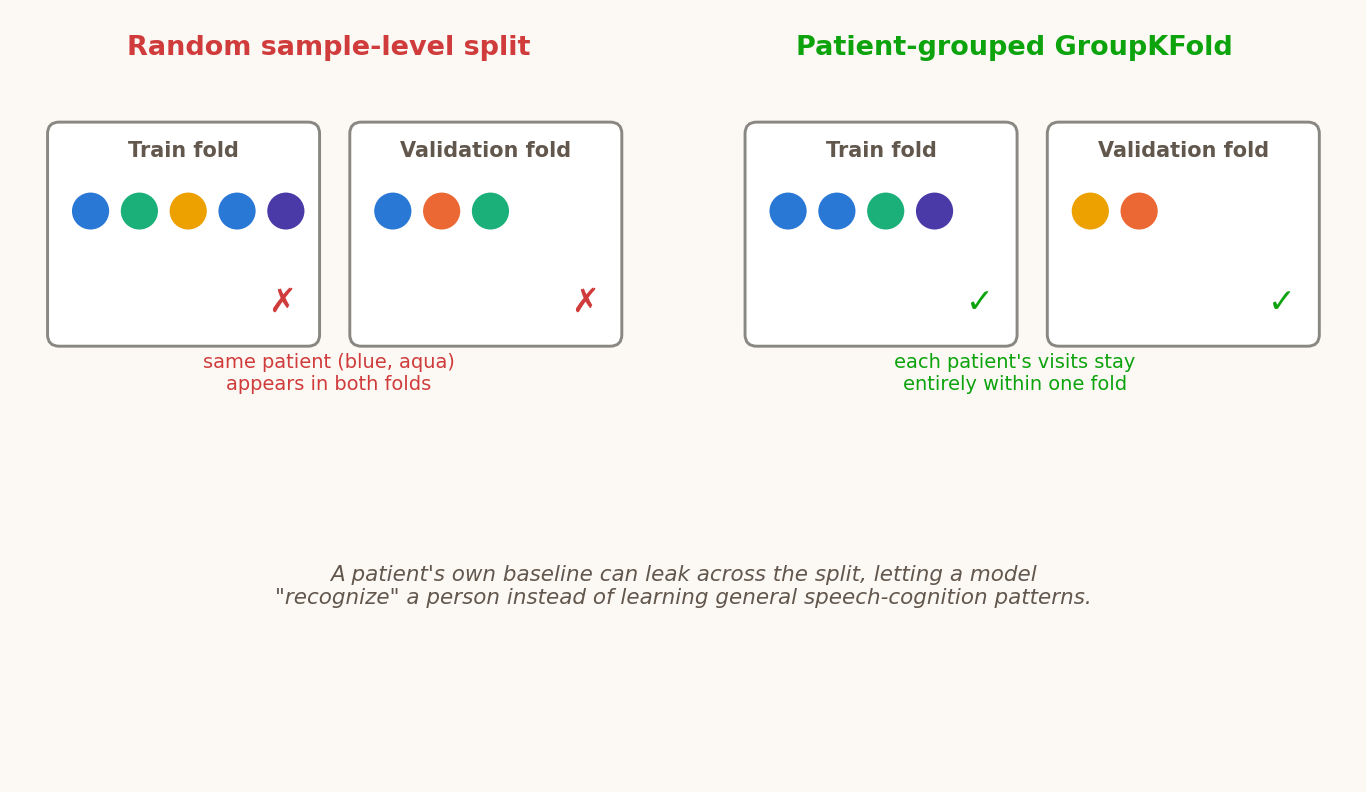
The fix: 5-fold GroupKFold grouped by patient ID. The augmented copies carry their parent's ID, so they stay in their parent's fold, and metrics are computed only on out-of-fold predictions for the original, unaugmented samples. The scores went down after the fix, which is what removing leaked information should do.
A second problem surfaced in December 2025. Entry MMSE, which should be the strongest single predictor, was contributing almost nothing. Two silent data-joining bugs were responsible: a renamed spreadsheet column and a string-versus-integer patient-ID mismatch. Because of them, every patient received the same imputed value. Fixing them produced the largest single improvement in the project (write-up).
In July 2026, before submission, I checked the draft line by line against the code. It still described six coreference and entity-transition features that the trained model never used. The Methods section was rewritten to describe the twelve features the model was actually trained on (write-up).
Results
| Metric | Value |
|---|---|
| R² | 0.840 ± 0.015 |
| RMSE (MMSE points) | 2.75 |
| MAE (MMSE points) | 2.02 |
| Pearson r | 0.917 |
An average error of about two MMSE points is similar in size to the scoring variability reported between human raters on the MMSE itself. An earlier held-out test split (March 2026) gave R² 0.732. The paper reports patient-grouped cross-validation instead, which comes out higher. Because selection and tuning were not nested (see Limitations), the paper notes that the cross-validation figure may be optimistic.
Ablation: what actually contributes
To see where the accuracy comes from, each feature group was retrained alone. Every run used the same fixed, untuned LightGBM (300 trees, depth 3, learning rate 0.05) under the same patient-grouped folds, so any difference between rows comes from the features alone.
| Feature subset | R² (mean ± SD) | RMSE | MAE | r |
|---|---|---|---|---|
| Linguistic features only | 0.118 ± 0.140 | 6.38 | 4.91 | 0.429 |
| SBERT embeddings only | 0.458 ± 0.170 | 4.94 | 3.91 | 0.699 |
| Clinical/demographic only | 0.716 ± 0.080 | 3.56 | 2.52 | 0.859 |
| Speech (linguistic + SBERT) | 0.437 ± 0.180 | 5.04 | 3.80 | 0.683 |
| Clinical + SBERT | 0.759 ± 0.086 | 3.26 | 2.42 | 0.880 |
| All features | 0.740 ± 0.080 | 3.39 | 2.41 | 0.869 |
| All features, no longitudinal change features | 0.740 ± 0.077 | 3.39 | 2.45 | 0.868 |
Clinical history is the strongest single source by a wide margin. SBERT embeddings carry far more signal than the handcrafted linguistic features, and combining the two speech sources doesn't beat SBERT alone. Adding SBERT to the clinical features gives the best subset (0.759 against 0.716), but the standard deviations overlap, so this is directional evidence of complementary signal, not a demonstrated gain. Removing the visit-to-visit change features changed nothing (0.740 both ways). A January 2026 conclusion that depended on them did not survive this controlled rerun (write-up).
Limitations
- Non-nested selection and tuning. Correlation pruning, permutation-importance selection, PCA and the Optuna search were each run once on the full dataset, not refit inside the folds. Selection and tuning depend on the labels, so the reported cross-validation metrics may be optimistic.
- Small, single cohort. The study has 126 patients and 173 samples from one corpus, with no external validation. Very few patients score below 10, and the model over-predicts for them.
- Speech's contribution is modest. Most of the accuracy comes from clinical history. The case for speech rests on the SBERT increment in the ablation.
- Missing data sources. The data include no imaging, biomarkers or medication history. The paper also lists benchmarking against simpler baselines, such as linear regression on clinical features, as future work.
Research log
I wrote these posts as the work happened, and the dates are the original posting dates. The early entries describe approaches that were later dropped, including an LSTM and the coreference features.
- Framing the problem
- Starting From Zero: Learning How Research Problems Get Made
- Narrowing In: Why Speech, and Why Dementia
- Discourse Coherence 101
- Finding a Dataset: DementiaBank and the Pitt Corpus
- Building the pipeline
- From Transcripts to Tables: First Preprocessing Pass
- Teaching a Model to "Read" Meaning: Adding SBERT
- Coreference, Entity Tracking, and a Frustrating Virtual Environment
- First Modeling Attempt: The LSTM That Wasn't Ready
- Back to Basics: Random Forests Beat the Neural Net
- Building Out the Feature Set: Trajectories, Gaps, and History
- Evaluation, bugs and the model
- Moving to LightGBM and Meeting Optuna
- The Leakage Problem: Rebuilding Cross-Validation From Scratch
- Adding the Clinical Picture
- A Silent Bug and the Biggest Single Improvement
- What's Actually Driving the Predictions? Feature Importance Deep Dive
- Ablation Studies: How Much Do Speech Features Really Add?
- Ensembles, Noise Augmentation, and Rejecting a Long List of Ideas
- Locking In the Final Model and a Held-Out Test Set
- Writing and submission
- Starting to Write: Learning the Shape of a Research Paper
- Drafting Methods and Results
- Wrestling With the Discussion Section
- First Full Draft Done
- Checking the Draft Against the Code
- Rerunning the Ablation for the Paper
- Submitting to Frontiers in Aging Neuroscience
- Where the Paper Stands